Cassandra
Introduction and Goal
Even before COVID-19, telemedicine was already a rapidly growing medical domain. It reduces the amount of resources hospitals need to dedicate to patients (beds, waiting rooms, examination rooms) and reduces the burden on the patient who can stay at home with their condition. With the introduction of the camera and microphone also come new opportunities for innovation in automation, machine learning, and artificial intelligence. The following describes one such innovation my colleagues and I explored at Memorial Sloan Kettering Cancer Center. Specifically, I was interested in how useful augmented reality (AR) and computer vision were in a mobility assessment setting.
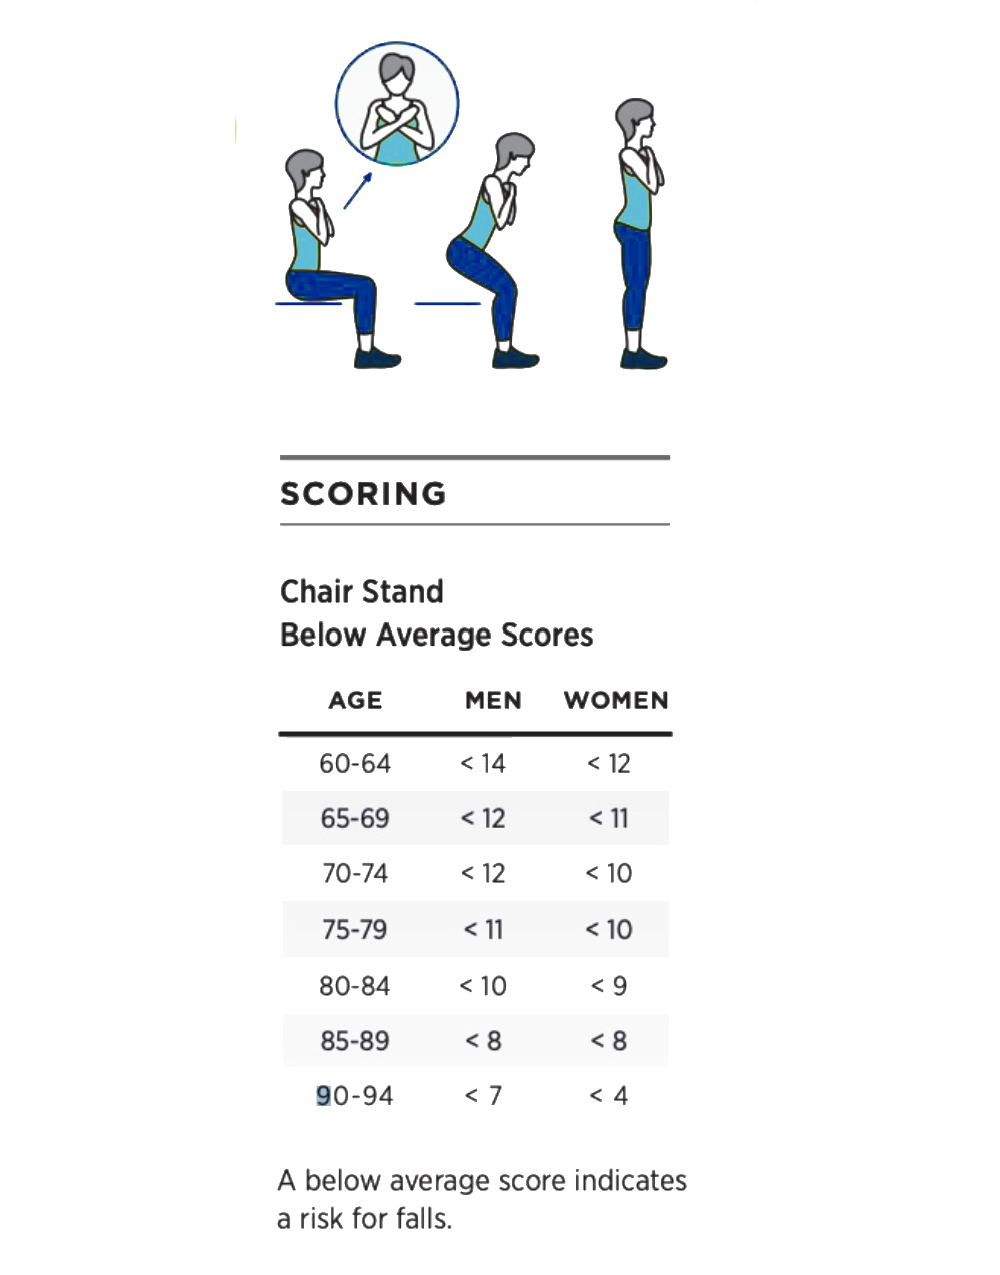
Figure 1 - Sit to Stand exercise instructions
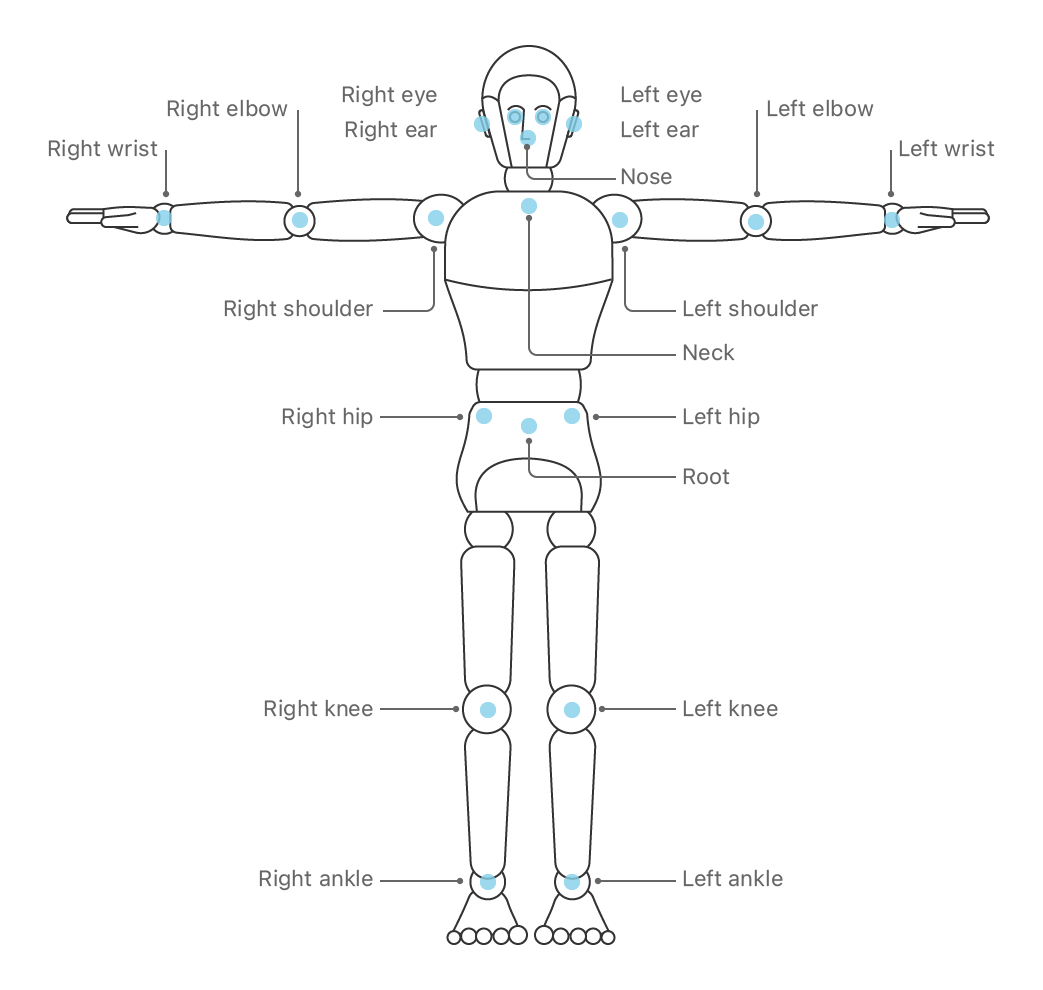
Figure 2 - Position of the landmarks
Data and Application
After major surgery to the legs, pelvis, or torso, it is not uncommon for patients to suffer a temporary loss or reduced mobility. The patient needs to rehabilitate through physical exercises, and it is important for the clinician guiding this rehabilitation to have a good sense of any progress or setbacks the patient might experience. In a traditional setting, the patient would come to one of the outpatient treatment centers for a mobility assessment through various tests. One very common test of mobility is the sit-to-stand test. The patient is asked to sit upright on a chair, arms crossed over the chest, stand up, sit down again, and repeat this process for 30 seconds. The number of full sit-to-stands is useful for the clinician to track the patient's progress over time through multiple visits. In addition, the clinician can observe the patient's movement and determine what is causing the mobility to be impaired. For example, the patient might put much weight on one foot, rising asymmetrically, to unburden the other, perhaps a painful leg. Or the patient might show tremors, indicative perhaps of an overall muscle tone and strength loss.
2 - Data and Application (continued)
All of these things are possible through telemedicine visits, but with some caveats. First and foremost, the environment in which the patient is performing the test is poorly controlled, at least from the clinician's point of view. Viewing a patient perform a sit-to-stand test through a webcam is perhaps the biggest bottleneck. In a hospital setting, the clinician can view the patient from multiple angles to better examine any issue in mobility. In a telemedicine setting, the patient is on screen, and the webcam allows the clinician only a single point of view.
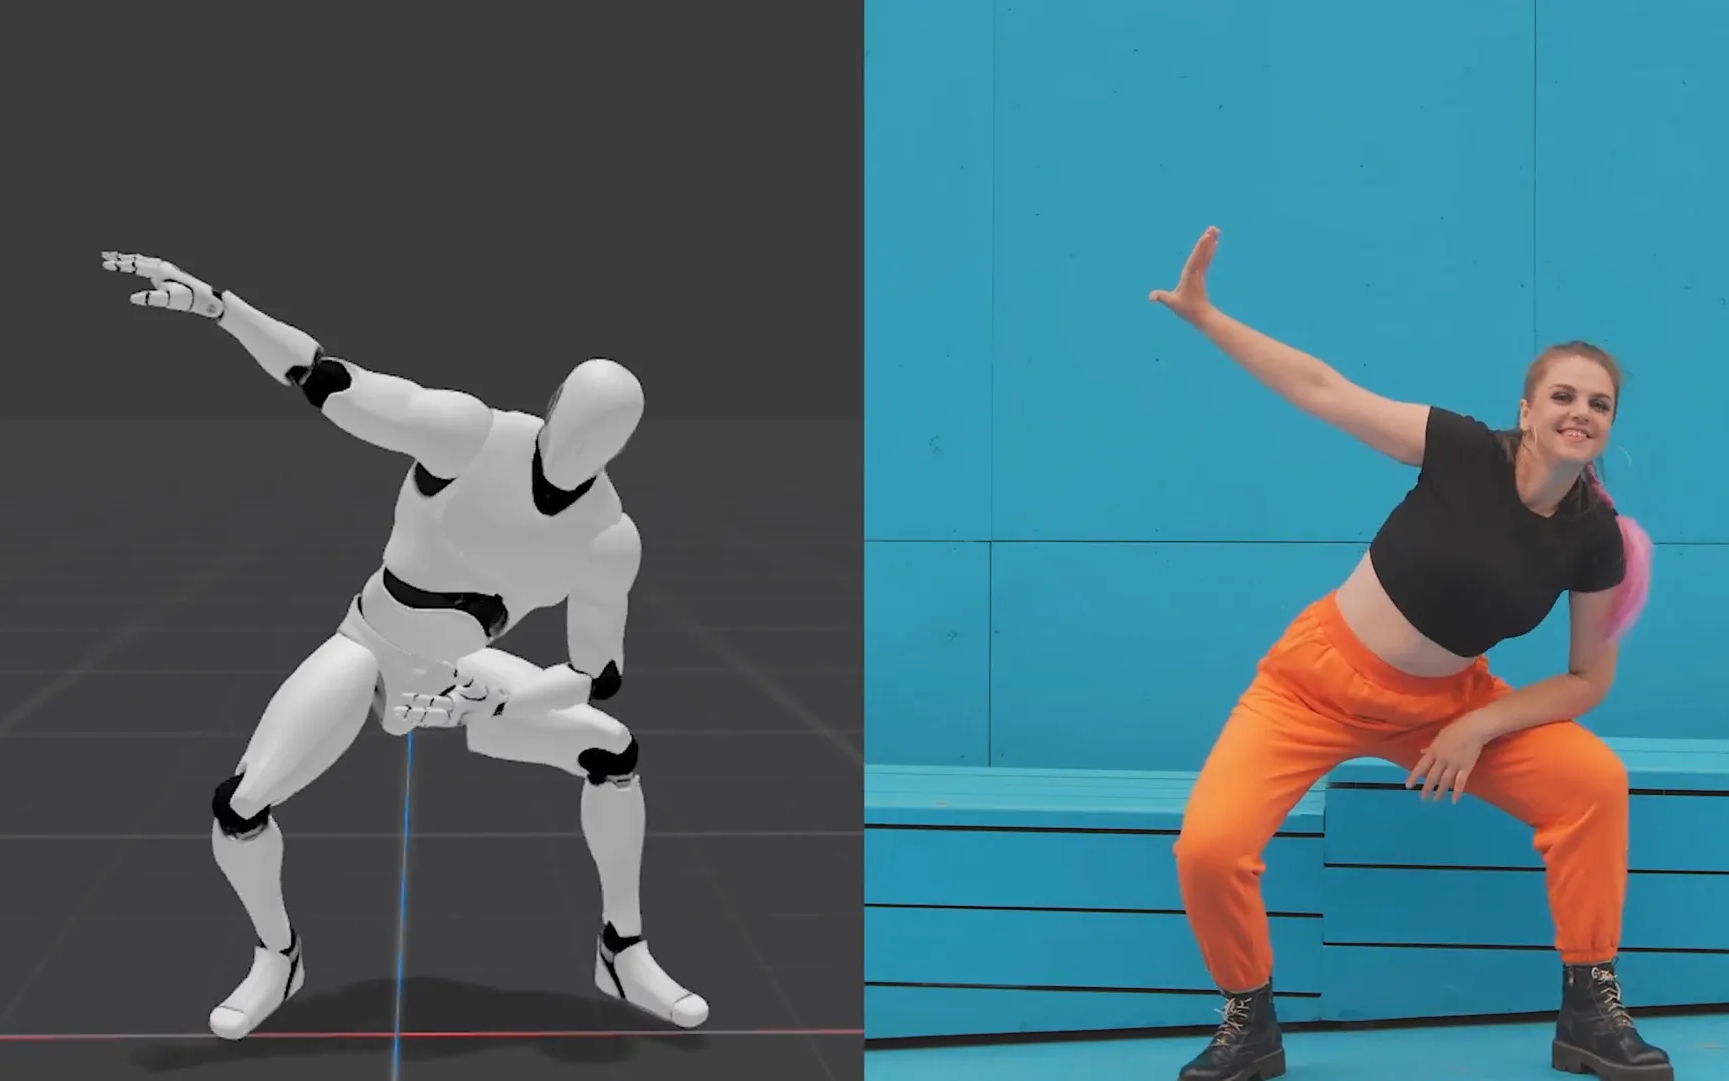
Figure 3 - Sit to stand exercise captured by our application as
seen on the phone or other smart device, with the detected skeleton overlaid
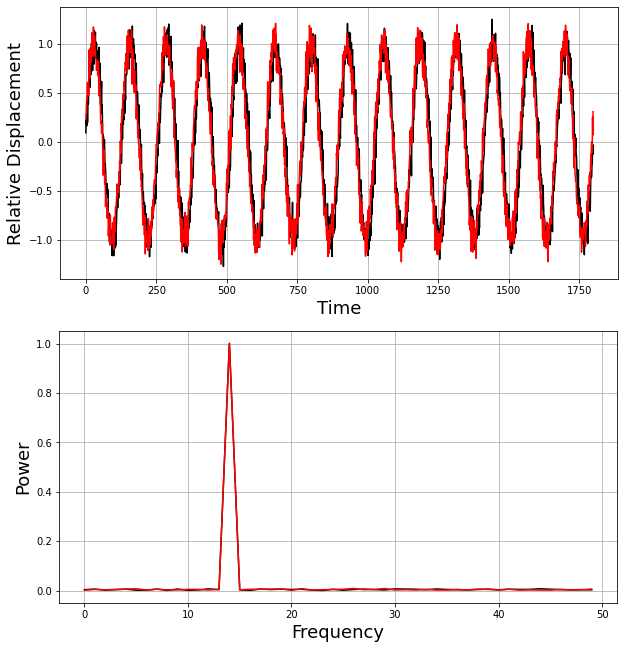
Figure 4 - (Top) A normal displacement pattern for the left (black) and right
knee
(red) of a person performing a sit-to-stand. (Bottom) In the frequency domain,
this revealed as a peak at the dominant frequent, the frequency of the sit-to-stands
(about 14 per 30 seconds).
Technology
My team and I built a mobile application using augmented reality and computer vision to automatically track the patient during the sit-to-stand and overlay this information on top of the video feed. Specifically, we used posture recognition machine learning algorithms (IOS Vision toolbox) that track the location of several key body landmarks, primarily joints. This is similar to facial recognition, where key facial features (eyes, nose, mouth) are detected and tracked. Once detected in the image, the algorithm converts them into points in 3d space, creating a skeleton model. In addition, the landmarks and their connections can be overlayed on the video feed, increasing the information available to the clinician when viewing the feed. The resulting data (both the absolute and relative landmark positions over time) can be used to automatically count the number of completed sit-to-stands. However, more importantly, it allows the exercise to be a) replayed and b) replayed from any angle deemed informative. The skeleton model can be seen as it displaces from a side view, whereas the feed itself was only ever strictly from the front. Finally, by analyzing the relative positions over time, we can compute various medically relevant metrics. For example, how much tremor was observed? Or whether the patient performed the exercise asymmetrically.
Analysis and Results
I analyzed the resulting data by transforming it into the time/frequency domain using the Fast Fourier Transform. The algorithms are not 100% accurate, and people differ in size and shape. In addition, the camera angle is likely to vary between sessions and definitely between different patients. Even when considered in relative terms, analyzing the data in the space/time domain is extremely hard and cumbersome. Converting the data into the frequency domain removes much of the ambiguity, leaving the dominant frequency and phase of each landmark. Based on conversations with the rehabilitation staff, I created three metrics that we deemed essential to assess progress or the need for possible medical intervention.
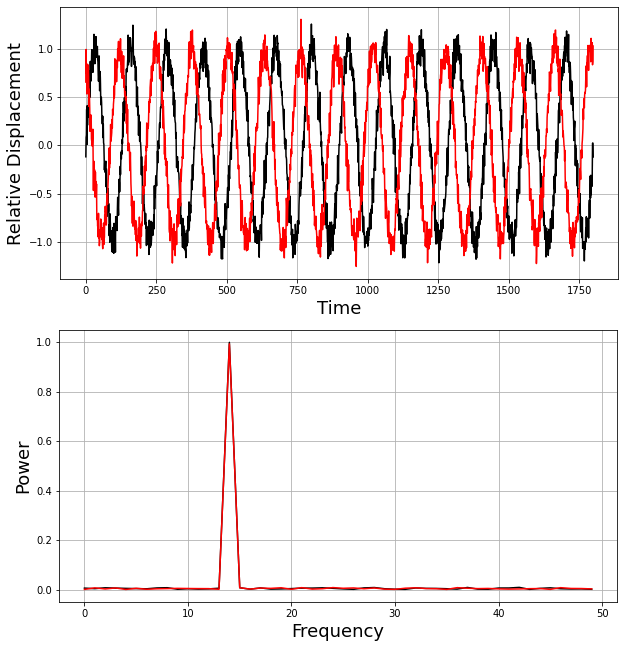
Figure 5 - (Top) An asymetric displacement pattern where the left knee (black)
is out of phase with the right knee (red). This means that the patient is rising and sitting
down again asymetrically, with one side of the body move up and downwards before
the other side of the body. In the frequency domain, nothing has changed, both
joints still cycle at the same frequency. It is when we look at the relative
phase that we discover the asymetry.
Figure 6 - Replay Rendering of a noisy measurement (right), compared to a good measurement with a nominal sit-to-stand pattern (left). In this case, I dimmed the lights, making it much harder for the computer vision in the app to accurately track the joints from the camera input.
Figure 7 - Replay Rendering of a measurement of a patient experiencing tremor (right), compared to a good measurement with a nominal sit-to-stand pattern (left). This was a simulated tremor, enacted by one of my colleagues.
Figure 8 - Replay Rendering of a asymetric sit-to-stand (right), compared to a good measurement with a nominal sit-to-stand pattern (left). As before, this asymetry was acted out.
Visualizations
We rendered the detected skeletal positions of 4 example exercises, using data recorded from our AR application on my colleagues, which can be seen in Figures 6, 7 and 8.
Impact
Visualized in this way, with the metrics added, a wealth of data becomes available to the clinician that otherwise would not have been available during a telemedicine visit. In addition, the metrics can be computed automatically and stored for comparison with past and future measurements, giving the clinical staff a holistic and quantified overview of the progress made by the patient in regaining mobility after surgery.
Technologies Used